End-to-End KPI System for DVC Apartments: Configuration to AI Reporting
DVC Apartments manages dozens of short-term rental apartments and needed to track individual Property Manager performance against monthly budgets, compare data with the previous year, and generate strategic reports without manual work. I designed an end-to-end KPI system that integrates robust backend, granular data models, and a backoffice interface with AI insights.
Data structure: from configuration to real metrics
The system revolves around three main Mongoose entities. KpiYearConfig stores annual configuration: monthly budget for each metric (12 values), previous year data for YoY comparisons, and Time-to-Book parameters for 6 OTA channels (Airbnb, Booking.com, Holidu, Italianway, VRBO, direct). It also includes internal benchmarks: targets for direct % bookings, review rate, Airbnb rating, and Booking rating.
PmMonthlyActual tracks 9 metrics for each PM each month: gross revenue, net revenue from cleaning (TNP), occupancy %, number of bookings, ADR (Average Daily Rate), % direct bookings, number of reviews, Airbnb rating, and Booking rating. The unique index is composed of year, month, and pmUserId, ensuring atomicity and fast queries.
ApartmentKpiAssignment assigns each apartment to a PM with a complexity tier (Economy, Standard, Premium, Luxury). Each tier has a weight multiplier (1x, 1.5x, 2.5x, 4x) that determines how budget is allocated across PMs: a Luxury property is worth 4 times an Economy property with identical metrics.
Backend: modularized APIs and smart synchronization
The Express backend exposes 5 groups of REST endpoints with role-based authorization (ADMIN and EDITOR). Annual configuration supports POST with CSV/JSON import, GET to read budgets and TTB, PATCH to update internal benchmarks. The config.ts service also generates downloadable CSV templates with Italian headers, facilitating offline completion.
The actual.ts service implements UPSERT for monthly data: if the index (year, month, pmUserId) exists, it updates; otherwise it creates. Important: I implemented automatic PM name synchronization in case of rename, preventing inconsistencies in historical reports. Queries are filtered by role: ADMIN sees all PMs, EDITOR sees only their own data.
The assignments.ts service performs bulk writes with upsert to assign or reassign apartments to PMs with tier changes in a single operation, scaling to hundreds of updates without timeout.
// config.ts: CSV import with validation
import { parse } from 'csv-parse/sync';

export async function importBudgetFromCsv(csvBuffer: Buffer, year: number) {
  const records = parse(csvBuffer, { columns: true, skip_empty_lines: true });
  const budgets = records.map((row) => ({
    metric: row.metriche,
    jan: parseFloat(row.gennaio),
    // ... other months
  }));
  return KpiYearConfig.findOneAndUpdate(
    { year },
    { budgets, updatedAt: new Date() },
    { upsert: true, new: true }
  );
}// actual.ts: upsert monthly data with PM synchronization
export async function upsertPmMonthlyActual(
year: number,
month: number,
pmUserId: string,
data: PmMonthlyActualInput
) {
const pmUser = await User.findById(pmUserId);
return PmMonthlyActual.findOneAndUpdate(
{ year, month, pmUserId },
{
...data,
pmName: pmUser.name, // sync name
updatedAt: new Date(),
},
{ upsert: true, new: true }
);
}Prompt engineering for summary and operational reports
The prompts.ts service provides two templates for Claude. The monthly report sends the model structured data of budget, this year's actual, previous year's actual, and average TTB, asking for performance analysis with YoY comparisons, revenue management recommendations, and alerts on critical metrics.
The weekly report is more operational: it sends progress status for each PM, TTB by channel, aggregated DVC total, and expected progress calculated based on the week (week 1 = 25% of monthly target, week 2 = 50%, etc.). Claude generates a report with on-track/behind status for each PM and 3 concrete actions to recover or maintain trajectory.
// prompts.ts: monthly report prompt
export const monthlyReportPrompt = (
  config: KpiYearConfig,
  actual2026: PmMonthlyActual[],
  actual2025: PmMonthlyActual[],
  month: number
) => `
Analyze KPI performance for ${ITALIAN_MONTHS[month]} 2026.
Budget: ${config.budgets.map(b => b.label + ': ' + formatEUR(b[monthKey])).join(', ')}
Actual 2026: ${actual2026.map(a => a.metric + ': ' + formatEUR(a.value)).join(', ')}
Actual 2025: ${actual2025.map(a => a.metric + ': ' + formatEUR(a.value)).join(', ')}

Generate:
1. Budget variance vs actual (% and absolute value)
2. YoY comparison with insights
3. Critical metrics
4. 3 revenue management actions
`;
Backoffice: ADMIN dashboard and self-service editor
The Next.js 14 frontend with App Router exposes two main views. The ADMIN dashboard is SSR and loads in parallel config, actuals, assignments, apartments, users, and available years. The interface is organized in 5 tabs covering the entire KPI management.
The EDITOR view is access-controlled: the authenticated PM accesses only the selected month and completes the form for their own KPIs. Once saved, data immediately flows into queries and reports for ADMIN.
Tab 1: Global dashboard
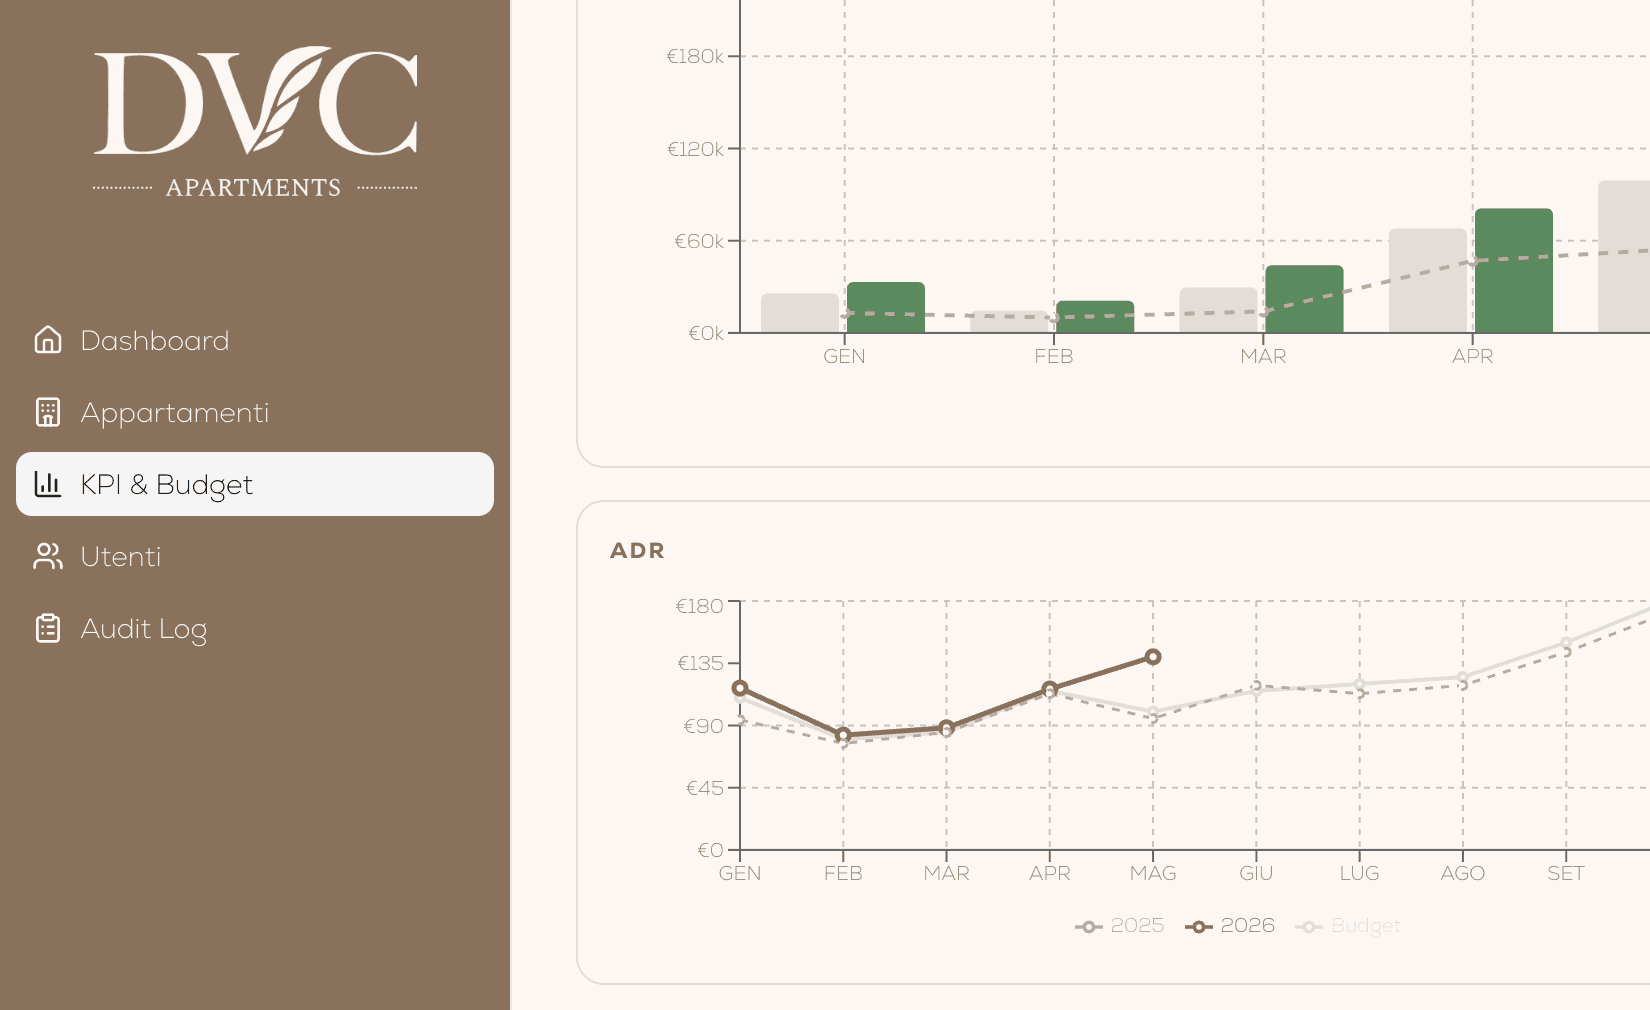
Shows KPI cards with budget vs actual, % variance, and visual indicators. A Recharts bar chart colors revenue in green if it reaches budget, red if it falls short. Line chart for ADR and occupancy over time, bar chart for monthly cleaning pickup. A summary table shows variance in colors for quick reading.
Tab 2: KPI by PM
A PmCard for each PM with custom budget calculated on overall tier weight (sum of multipliers of their apartments). A table shows Budget/Actual/Variance with up/down indicators for 7 metrics. An inline actual completion form is integrated for speed.
A WeeklyReport section allows selecting the week (1-4) and displays progress bar with % achievement vs expected (week × 25% of monthly target). A status light shows on-track/behind state. A button generates the weekly report via Claude, rendered in markdown.
// components/PmCard.tsx: custom budget calculation
export function PmCard({ pm, assignments, yearConfig }: Props) {
  const pmWeight = assignments
    .filter(a => a.pmId === pm.id)
    .reduce((sum, a) => sum + TIER_WEIGHTS[a.tier], 0);

  const pmBudgetShare = yearConfig.budgets.map(b => ({
    metric: b.label,
    monthly: (b.monthly * pmWeight) / totalWeight,
  }));

  return (
    <div className="border rounded-lg p-4">
      <h3>{pm.name}</h3>
      <p className="text-sm text-gray-600">Weight: {pmWeight.toFixed(2)}x</p>
      {/* Budget/Actual table */}
    </div>
  );
}
Tab 3: Apartment assignments
Management table with dropdown to select PM and Tier for each apartment. A stat card shows counts per PM and calculated weight %. Bulk change with server-side upsert, atomic save.
Tab 4: Time-to-Book (TTB)
Chart and table of TTB (days of advance booking) for 6 OTA channels, 12 months + annual average. Dedicated color palette per channel facilitates recognition. Strategic utility: high TTB indicates a "consolidated" month with little room, low TTB indicates opportunity for last-minute actions (discounts, direct promotions).
Tab 5: Monthly Report (AI)
5 summary stat cards of overall performance. A button generates the monthly summary report via Claude API with budget vs actual analysis, YoY comparisons, and recommendations. The response is rendered in markdown directly in the interface.
Utility library: formatters and KPI calculations
kpi-utils.ts centralizes formatters (EUR, %, integers with IT locale), budget allocation functions (calcPmWeight, calcPmBudgetShare), multi-PM aggregation (aggregateActualsByMonth sums revenue/bookings, averages occupancy/ADR excluding PMs without data). Includes constants: Italian months, tier weights, TTB channels with labels and colors, DVC palette.
// kpi-utils.ts: core calculations
export const TIER_WEIGHTS = {
  Economy: 1,
  Standard: 1.5,
  Premium: 2.5,
  Luxury: 4,
};

export function calcPmWeight(
  assignments: ApartmentKpiAssignment[],
  pmId: string
): number {
  return assignments
    .filter(a => a.pmId === pmId)
    .reduce((sum, a) => sum + TIER_WEIGHTS[a.tier], 0);
}

export function formatEUR(value: number): string {
  return new Intl.NumberFormat('it-IT', {
    style: 'currency',
    currency: 'EUR',
  }).format(value);
}
Claude API integration and report generation
The system integrates Anthropic SDK with temperature 0.3 (deterministic) and claude-sonnet-4-6 model. The POST API endpoints /api/kpi/reports/monthly and /api/kpi/reports/weekly receive structured data, build the prompt via prompts.ts, call Claude, and render markdown in the frontend.
The monthly prompt integrates extended context (12-month budget, 2026/2025 actual, average TTB) for rich analysis. The weekly prompt is leaner but includes status light for each PM (on-track if progress >= expected, behind if < expected) and 3 concrete actions based on low/high TTB and critical metrics.
Design decisions and tradeoffs
I chose MongoDB and Mongoose for schema flexibility and fast parallel queries. A compound index on (year, month, pmUserId) ensures atomic UPSERT without race conditions. Recharts for charts because it's lightweight and responsive on mount, avoiding heavy libraries like Chart.js.
For ADMIN/EDITOR authorization, I implemented Express middleware that checks role from JWT and filters queries. ADMIN sees everything, EDITOR accesses only pmUserId === req.user.id. This pattern scales well if more granular roles are added in the future (e.g., Finance, Ops).
PM name synchronization in actual.ts avoids historical inconsistencies: if a PM renames, all records from that PM keep the updated name. The alternative was duplicating pmName for reporting purposes, but synchronization is cleaner.
Generating downloadable CSV templates simplifies onboarding: non-technical PMs can fill out offline in Excel and re-import. csv-parse is lightweight and practical. Papaparse was an option, but native Node.js is better suited for the backend.
Results and impact
DVC Apartments now monitors each PM's performance in real time, automatically compares with budget and previous year, and generates strategic reports without manual compilation. PMs access the self-service editor and see immediate feedback. The ADMIN aggregated dashboard allows fast decisions on revenue management and apartment assignment. Claude integration automates summary and operational reporting, freeing resources for strategy rather than data entry.
The system was developed with TypeScript, unit tests on critical services (budget calculations, UPSERT), and deployed on Vercel (frontend) and dedicated Node.js server (backend). Backend horizontal scalability is ready if the number of PMs and apartments grows.